Property Playbook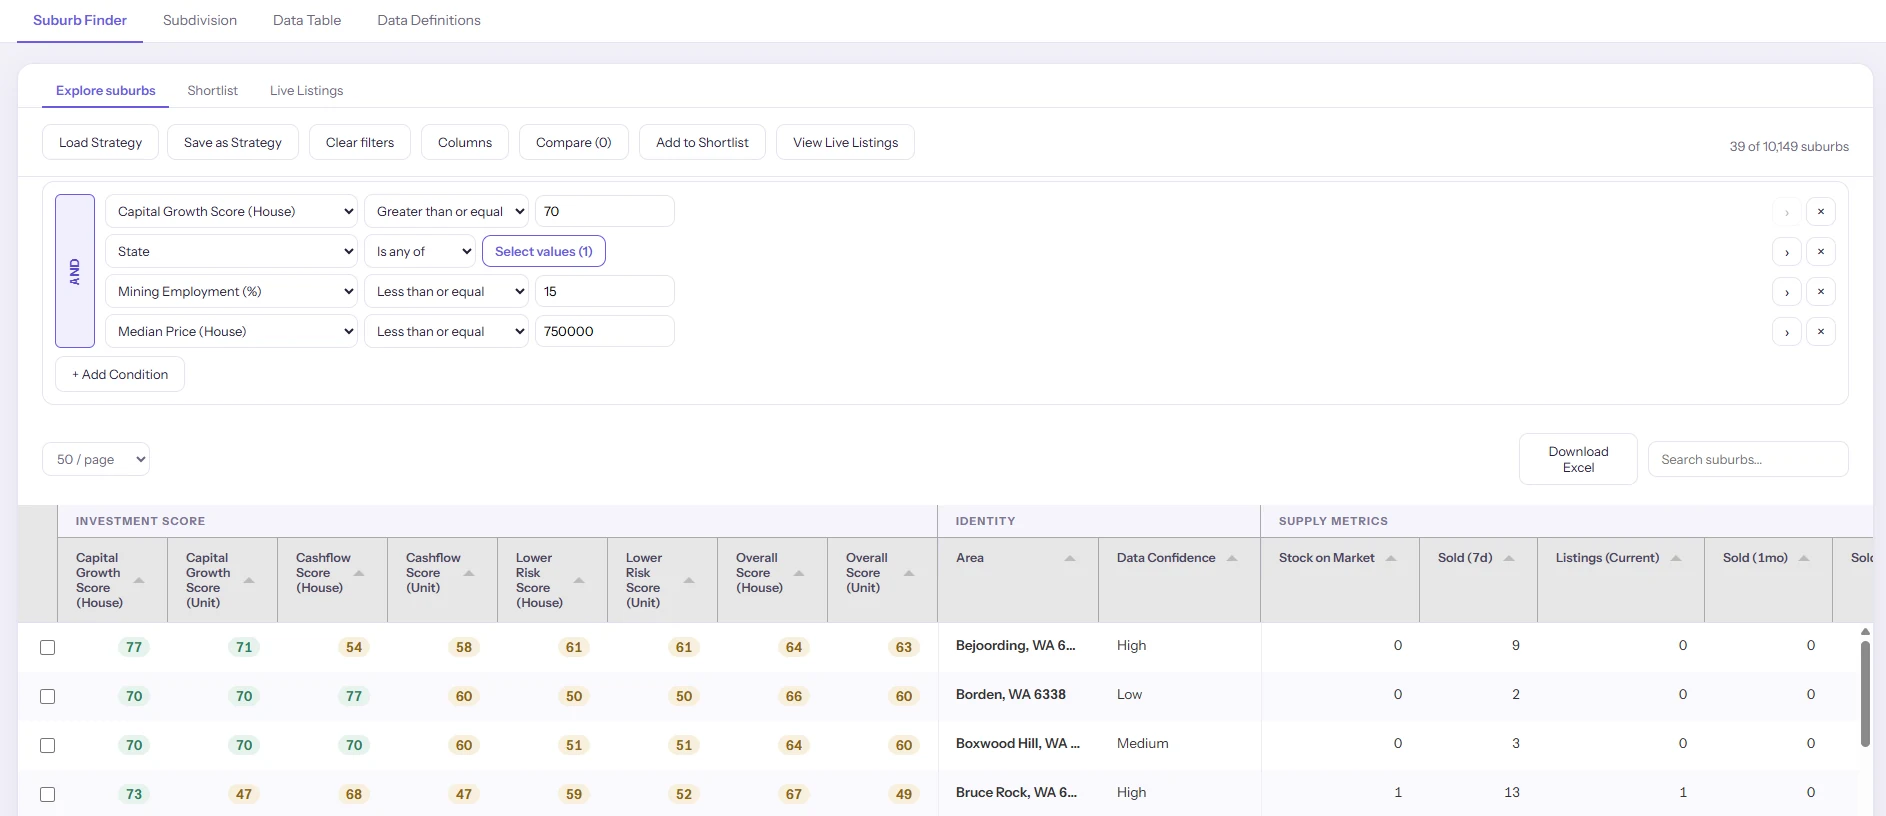
Suburb Finder
10,000 suburbs, scored the same way.
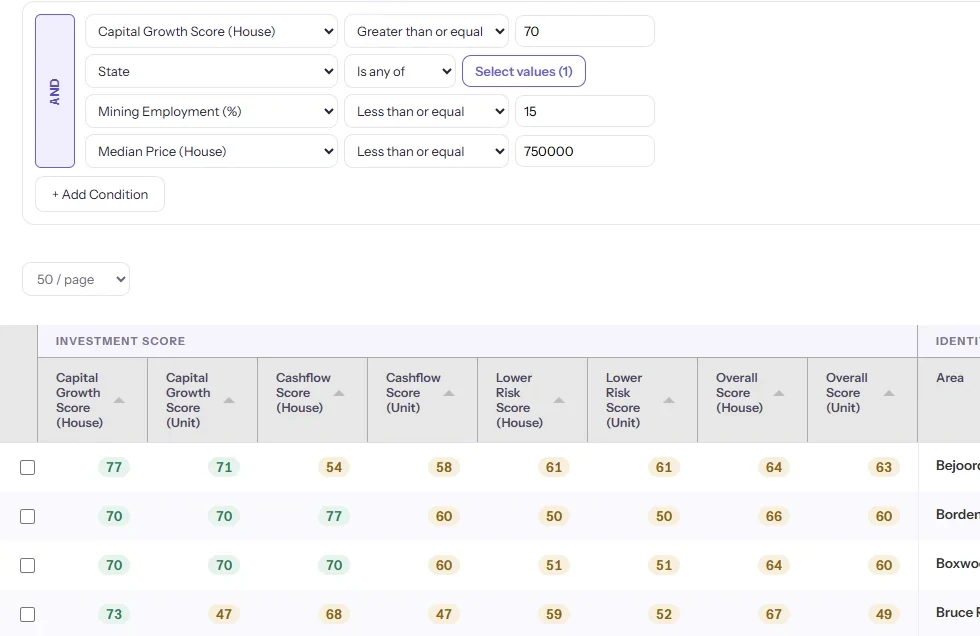
Build a filter across any metric, compare suburbs side by side and save the filters to re-run on next week's data.
- Capital growth, cashflow, risk and overall scores — houses and units scored separately, never blended
- Gross yield, months of supply, sale-through rate, price spread and growth-cycle position
- Population growth, household income, owner-occupier split, industry mix, building approvals and infrastructure spend per capita
- A comparable count and confidence rating on every figure, so thin data is visible before it reaches a client